Quick answer
Exit code 137 = 128 + 9 = the process received SIGKILL. It's usually the kernel's OOM killer, but not always — confirm it first with docker inspect <container> --format='{{.State.OOMKilled}}'. If true: raise the memory limit if the workload genuinely needs it, fix runtime heap sizing (Java/Node), or track down a real memory leak with docker stats over time before just bumping the number.
The exact signal
$ docker ps -a
CONTAINER ID   IMAGE       STATUS
a1b2c3d4e5f6   my-api      Exited (137) 3 minutes ago

$ docker inspect a1b2c3d4e5f6 --format='{{.State.OOMKilled}}'
true
What it actually looks like
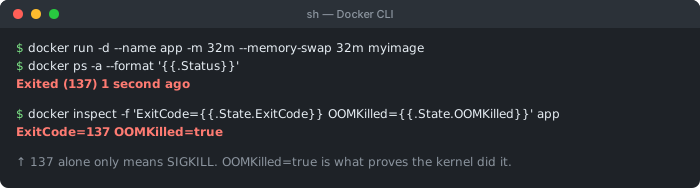
-m 32m and letting it allocate. This is the check the whole page turns on: 137 on its own only tells you the process received SIGKILL, which is equally what docker kill or an operator would produce. OOMKilled=true is the field that proves the kernel did it for memory — and if it reads false, you are debugging the wrong thing entirely.137 is Docker's convention of 128 + signal number, and signal 9 is SIGKILL — an unconditional, un-catchable kill with no chance for the process to clean up. The OOM killer always uses SIGKILL, which is why 137 is strongly associated with memory exhaustion. But it is not the only thing that sends SIGKILL, which is exactly why the confirmation step above matters before you spend time chasing a memory leak that doesn't exist.
Troubleshooting at a glance
The single OOMKilled flag splits this error into two completely different worlds. Start here:
Step 1: confirm it was actually the OOM killer
Don't assume — check. This single flag tells you definitively whether memory was the cause:
docker inspect <container> --format='{{.State.OOMKilled}}'
# true  -> the kernel's OOM killer terminated this container specifically
# false -> SIGKILL came from somewhere else (see "other causes" below)
You can also confirm it at the kernel level. On the Docker host (not inside the container), the OOM killer logs every kill it performs:
dmesg | grep -i "killed process"
# or on systemd hosts:
journalctl -k | grep -i "out of memory"
cgroup v1 vs v2: most current Linux distributions (and Docker Desktop) now default to cgroup v2 rather than the older v1. This doesn't change anything you do on this page — Docker reports OOMKilled: true and the kernel logs the kill identically regardless of the cgroup version. If docker inspect shows the flag, you can trust it either way.
Step 2: figure out which scope ran out — container or host
The same OOM killer operates at two different scopes, and the fix is different for each:
| Scope | What happened | Where to look |
|---|---|---|
| Container cgroup limit | Your container hit its own -m/mem_limit ceiling; only that container is killed | docker inspect --format='{{.HostConfig.Memory}}' |
| Whole host | No limit was set (or it was fine), but physical memory + swap on the machine itself ran out; the kernel picks a victim anywhere on the box | free -h, docker stats across all containers, not just this one |
On macOS and Windows the "host" is the Docker Desktop VM, which has its own separate ceiling — see the next section.
Docker Desktop (macOS/Windows): the VM has its own memory ceiling
On macOS and Windows there is no Linux "host" in the usual sense — the daemon and every container run inside a single Docker Desktop VM, and that VM is allocated a fixed slice of your machine's memory. Even a container with no -m limit of its own can't exceed what the VM has, so a memory-hungry container gets OOMKilled the moment the whole VM fills up. Raise the VM's allocation here:
Docker Desktop → Settings → Resources → Advanced → Memory limitThis is one of the most common reasons a container that runs fine in CI or on a Linux server gets OOMKilled only on a developer's Mac or Windows laptop — the default Docker Desktop memory allocation is simply smaller than what the workload needs.
Fix 1: the workload genuinely needs more memory — raise the limit
If usage sits at a stable, predictable working set that's simply higher than your original budget, raising the limit is the correct, complete fix:
# docker run
docker run -m 1g my-api

# docker-compose.yml
services:
  api:
    mem_limit: 1g

# Kubernetes
resources:
  limits:
    memory: "1Gi"
Before raising it, watch the trend with docker stats for a while — a stable plateau near the limit supports "just needs more"; a line that keeps climbing without leveling off supports "leak" (Fix 3), and a higher limit there just delays the identical crash.
Fix 2: runtime heap sizing that ignores the container limit
Several language runtimes historically sized their default heap from the host's total memory, not the container's cgroup limit — a container capped at 512MB but running on a 64GB host would happily try to grow a multi-gigabyte heap and get OOMKilled almost immediately.
# Java (JDK 10+ has UseContainerSupport on by default, but pin it explicitly):
java -XX:MaxRAMPercentage=75.0 -jar app.jar
# leaves ~25% headroom for thread stacks, metaspace, and off-heap buffers

# Node.js — the V8 heap default also isn't container-aware:
node --max-old-space-size=384 server.js   # for a 512MB container limit

# Python — no heap flag as such, but cap worker count so total RSS fits:
gunicorn --workers=2 --max-requests=1000 --max-requests-jitter=100 app:app
The Node and Java flags above are deliberately set below the container's memory limit, not equal to it — thread stacks, native buffers, and the runtime's own bookkeeping all need headroom outside whatever number you hand to -Xmx or --max-old-space-size.
Fix 3: it's a genuine memory leak
If memory climbs steadily over hours or days instead of leveling off at a working set, no limit is generous enough — you're watching a leak, and it will eventually hit any ceiling you set. Confirm the trend and then look at what's actually accumulating:
# watch live, container-scoped memory over time
docker stats <container>

# Node: a leak often shows as a growing heap even after forced GC —
# take two heap snapshots an hour apart and diff them in Chrome DevTools

# Python: common culprits are a growing in-memory cache/list with no eviction,
# or objects held by closures/listeners that are never unregistered
A pragmatic stopgap while you track down the real leak: recycle worker processes periodically (gunicorn --max-requests, PM2's max_memory_restart) so accumulated memory gets released on a schedule instead of crashing unpredictably in production.
How this looks in Kubernetes
Same mechanism, different vocabulary. A pod hitting its memory limit shows up like this:
$ kubectl describe pod my-api-7d4f9c
Last State:   Terminated
  Reason:     OOMKilled
  Exit Code:  137
Kubernetes distinguishes this from eviction: when the whole node is under memory pressure, the kubelet can proactively remove entire pods (lowest-priority/most-over-limit first) before the kernel OOM killer would even trigger. That shows Reason: Evicted, not OOMKilled — a node-level capacity problem rather than one pod exceeding its own limit, and it needs more cluster capacity or better resource requests/limits across pods, not just a bigger number on this one deployment.
When 137 is NOT about memory
Because 137 only encodes "received SIGKILL," a few other things produce it identically — and OOMKilled: false from Step 1 tells you decisively that you're in one of these cases instead:
- A
docker stopthat didn't exit cleanly within its grace period, escalated automatically todocker kill(SIGKILL) - A failed Docker or Kubernetes healthcheck causing the platform to forcibly kill an unresponsive container
- An operator or script running
docker kill <container>directly - An orchestrator forcefully rescheduling/stopping a container during a deploy or scale-down
…and when memory kills a container without exit 137
The section above is the half of this that gets written about. The other half is worse, because it sends you looking in the wrong place: an OOM kill does not always produce exit code 137. If the process the kernel chooses is not PID 1, the container's main process can go on to finish normally and report whatever status it likes — including 0.
All four combinations, run on Docker 25.0.2 against a 32 MB limit:
| What happened | ExitCode | OOMKilled | What docker ps -a shows |
|---|---|---|---|
| PID 1 is itself the memory hog | 137 | true | Exited (137) |
| A child process is OOM-killed; PID 1 then exits cleanly | 0 | true | Exited (0) — looks like success |
External docker kill, no memory pressure at all |
137 | false | Exited (137) |
JVM with -Xmx512m inside --memory=128m |
137 | true | Exited (137), and no Java output |
Row 2 is the trap. A shell script that runs a build step, an import, or a dd — anything where PID 1 launches a child and carries on — can have that child killed for memory and still exit 0. Nothing in the status line hints at it. If you are triaging by exit code, you will write the incident off as "not memory" and go looking at application logic.
# a child is OOM-killed, but PID 1 (the shell) exits 0 anyway
$ docker run --name b1 --memory=32m --memory-swap=32m alpine \
    sh -c 'dd if=/dev/zero of=/dev/shm/f bs=1M count=500 2>/dev/null; echo done; exit 0'

$ docker ps -a --filter name=b1 --format '{{.Status}}'
Exited (0) Less than a second ago            # ← no sign of a kill

$ docker inspect b1 --format 'ExitCode={{.State.ExitCode}}  OOMKilled={{.State.OOMKilled}}'
ExitCode=0  OOMKilled=true                   # ← the truth
So the rule from Step 1 is stronger than it first appears, and it runs in both directions: the exit code is not evidence either way. {{.State.OOMKilled}} is the only field that answers the question. Check it even when the container exited 0, if memory is on your list of suspects at all.
The JVM case is its own discriminator
Row 4 is worth separating out, because it is the single most useful tell when a Java service dies in a container — and it decides whether you are reading OutOfMemoryError: Java heap space or this page. An explicit -Xmx overrides container awareness: UseContainerSupport only supplies the default heap, it does not cap a heap you asked for.
# heap smaller than the container limit → the JVM throws, and you get a stack trace
$ docker run --memory=256m temurin:21-jre-alpine java -Xmx64m ...
maxMemory=61MB
java.lang.OutOfMemoryError: Java heap space        # catchable, loggable
ExitCode=0  OOMKilled=false

# heap LARGER than the container limit → the kernel wins the race, and Java never speaks
$ docker run --memory=128m temurin:21-jre-alpine java -Xmx512m ...
maxMemory=494MB                                   # ← the JVM believed -Xmx, not the cgroup
(no further output at all)
ExitCode=137  OOMKilled=true
Read it as a decision: a Java OutOfMemoryError stack trace means the JVM stayed inside its own ceiling — the heap is too small, or you have a leak, and the heap-space page is where to go. A 137 with no Java output at all means -Xmx was bigger than the container, so the JVM was killed mid-allocation before it could diagnose itself. The absence of a stack trace is the signal, not an unlucky truncation of your logs.
All four rows reproduced on Docker 25.0.2; the JVM rows on Java 21.0.11 (eclipse-temurin:21-jre-alpine). Which process the kernel picks is an OOM-killer scoring decision, so row 2 depends on your container's process tree — the point is that exit 0 does not rule memory out, not that it always means a child died.
Debugging checklist
- ✓
docker inspect --format='{{.State.OOMKilled}}'— true or false, first, before anything else - ✓ If true: container limit (
-m/mem_limit) or whole-host memory? Check both - ✓ Mac/Windows: is Docker Desktop's own VM memory (Settings → Resources) large enough for the workload?
- ✓
docker statsover time — stable plateau (needs more memory) vs steady climb (leak)? - ✓ Java: is
-Xmx/-XX:MaxRAMPercentageleaving headroom below the container limit? - ✓ Node: is
--max-old-space-sizeset below the container's memory limit? - ✓ Kubernetes:
kubectl describe pod— "OOMKilled" (this container) or "Evicted" (whole node)? - ✓ If
OOMKilled: false: check for a healthcheck failure, a manual kill, or an orchestrator-triggered stop instead
Frequently Asked Questions
What does exit code 137 actually mean?
137 is Docker/Linux's convention of 128 + signal number, and 9 is SIGKILL — so 137 means the container's main process was forcibly killed and had no chance to shut down cleanly. The OOM killer sends SIGKILL, which is why 137 is strongly associated with 'out of memory', but a manual docker kill, a failed healthcheck killing the container, or an orchestrator forcefully stopping it also produce the exact same code.
How do I confirm it was actually the OOM killer?
Run docker inspect <container> --format='{{.State.OOMKilled}}'. If it prints true, the kernel's OOM killer specifically terminated this container for using too much memory. If it prints false, the process still received SIGKILL for another reason — a manual kill, a healthcheck failure, or the orchestrator stopping it — and you're debugging the wrong thing if you assume memory.
Is this the container's memory limit, or the whole host running out?
Both trigger the same OOM killer, at different scopes. If you set -m/mem_limit on the container, exceeding that cgroup limit gets only that container killed. If no limit is set (or the limit is fine) but the host itself runs out of physical memory and swap, the kernel's global OOM killer picks a victim process anywhere on the machine — which might be this container, a different one, or even something unrelated.
Why does my Java app get OOMKilled even though -Xmx is set below the container limit?
The JVM heap is only part of a Java process's total memory — thread stacks, metaspace, the JIT's code cache, and native/off-heap buffers all sit outside -Xmx and count against the container's cgroup limit too. Setting -Xmx close to the container limit leaves no room for that overhead. On modern JDKs (10+, with UseContainerSupport on by default), prefer -XX:MaxRAMPercentage (e.g. 75%) so the JVM sizes itself with headroom automatically.
How does this look different in Kubernetes?
Same underlying mechanism, different vocabulary. kubectl describe pod shows Last State: Terminated, Reason: OOMKilled, Exit Code: 137 when a container exceeds its configured resources.limits.memory. Kubernetes also distinguishes this from an eviction, where the kubelet proactively removes a whole pod under node memory pressure before the kernel OOM killer would even trigger — that shows a different reason ('Evicted'), not OOMKilled.
Should I just raise the memory limit and move on?
Sometimes — if the workload genuinely needs more memory than you originally budgeted, raising the limit is the correct fix. But if usage climbs steadily over hours or days rather than sitting at a stable working set, that's a memory leak, and a higher limit only delays the same crash. Track memory over time with docker stats or a metrics tool before deciding which situation you're in.
Does exit code 137 always mean memory?
No. 137 is just 'this process received SIGKILL' — it says nothing about why. A docker stop that times out and escalates to SIGKILL, a failed Docker/Kubernetes healthcheck killing an unresponsive container, or an operator running docker kill manually all produce the identical exit code 137 with OOMKilled reported as false. Always check the OOMKilled flag before assuming memory.
References
- Runtime options with Memory, CPUs, and GPUs (Docker Docs)
- docker container stats (Docker Docs)
More backend & build errors
Browse the full reference for Node.js, Python, Docker, and database errors — exact message, cause, and fix.